ipos · investor math
You picked the winner and still lost
Across the 30 largest tech IPOs (2012-2024), the average year-1 drawdown was −55%. And here's the uncomfortable part; even picking the absolute winner, the path punishes the average investor.
The IPO market doesn't warn you when euphoria turns into a trap.
The data does.
Across the 30 largest tech IPOs between 2012 and 2024, the average maximum drawdown in the first year was −55%. Only 43% traded above their debut price 12 months later. The worst: Robinhood −90%, Rivian −88%, Lyft −79%.
So far, the easy headline. Now the part nobody disputes.
Even when you're right, you lose
Suppose you have the gift. Out of those 30 listings, you pick exactly the ones that worked. Look at what your portfolio lived through along the way:
| Company | Year 1 | Max drawdown |
|---|---|---|
| MongoDB | +103% | −26% |
| Palantir | +153% | −53% |
| Datadog | +128% | −42% |
Palantir ended its first year up +153%. But at some point during that year, whoever bought the debut watched their position fall by more than half.
The question isn't whether you would have picked well. It's whether you would have sat through a −53% without selling. Fund-flow data says most people don't.
The math that explains it
A −55% drawdown requires a +122% recovery just to get back to your entry price. The function is not symmetric:
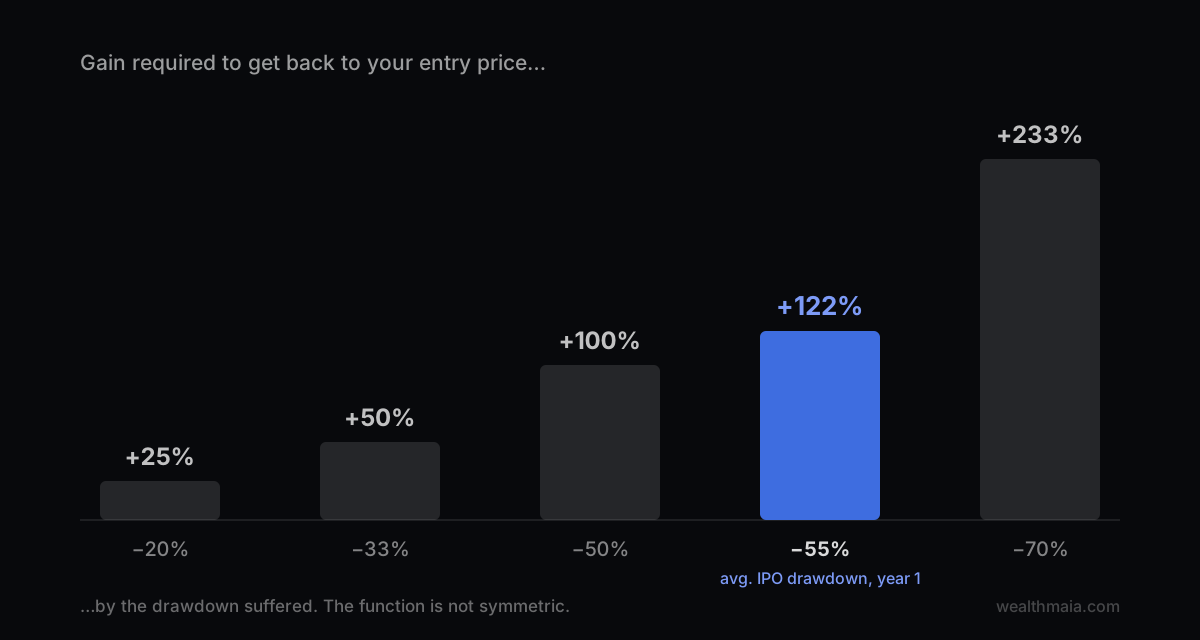
And there's a second, less intuitive layer: the geometric return your capital experiences is far below the asset's arithmetic return. The difference is paid by variance, not by the market. Two assets with the same average return can leave you with very different final capital; the one that swings less wins.
You don't need to pick the wrong company to lose money. Walking the path is enough.
The average investor doesn't sell at the peak. They sell in the valley. And in a recent IPO, the valley is statistically guaranteed: it's the price-discovery phase, with lockups expiring, analyst coverage just starting, and zero track record as a public company.
The case testing it right now
CoreWeave: +300% in 3 months since its IPO. The historical pattern across the 30 largest projects a drawdown of between −40% and −65% at some point in year one.
Is the business good? Probably yes.
Is the current price the optimal entry point? Historical data says that, systematically, the answer to that question after a debut rally is no. That's not a prediction about CoreWeave; it's what the pattern has done in 30 out of 30 prior cases: every one saw a meaningful valley in year 1, including the ones that ended up being big winners.
What this means in practice
The asymmetry between who sells in an IPO (insiders, VCs, banks with strategically designed lockups) and who buys (a market at peak media coverage) is structural. It doesn't disappear. It only changes shape.
If you still want exposure to a freshly listed company, the relevant number isn't "how much it could go up". It's: would you sit through a −50% without selling? If the honest answer is no, the problem isn't the company. It's the position size and the entry point.